Any company or organization can use Cassandra. It was created primarily for businesses that frequently manage large amounts of data.
What is Apache Cassandra?
Apache Cassandra is an open source, fully accessible NoSQL distributed database system that can reliably manage large amounts of data replicated across multiple computing systems. Companies like Spotify and Netflix have adopted Apache Cassandra. Cassandra can be downloaded for free from Apache ‘s official website.
How can I monitor Cassandra?
The primary goal of Cassandra monitoring is visibility, which results in information and intervention to improve database performance.
There are many platforms available on the internet to monitor Cassandra performance. In this article, we have compiled a list of the best Apache Cassandra monitoring tools to help you choose the best one for your monitoring needs.
solar winds
SolarWinds’ Server & Application Monitor (SAM) is a strategic and powerful Cassandra performance monitoring tool that improves database performance. Monitoring Cassandra requires a structured approach to prevent performance issues that can impact end users, such as network congestion or service interruptions.

This monitoring tool is easy to install, and initial configuration is just as easy to complete using automatic discovery steps. It is designed to identify and address the root causes of Apache Cassandra performance issues. Users can also drill into specific Cassandra clusters. Additionally, users can create personalized notifications.
Features:
- Customize the look of your dashboard by adding new widgets.
- Monitor your Cassandra database frequently.
- Manage multiple Cassandra monitoring dashboards in one place
- Infrastructure dependency mapping
- Create smart alerts to notify you of emergencies and thresholds appropriate for your Cassandra server.
- Investigate important performance factors in Cassandra
Constantly monitoring various key Cassandra metrics is the key to successful Cassandra monitoring. These key metrics track various aspects of your database to identify issues that can impact performance. If you want to preview the product before purchasing, you can download the fully-featured 30-day free version.
data dog
Datadog is a comprehensive monitoring solution for Apache Cassandra deployments, including a wide range of capabilities to monitor connections, events, apps, and network architecture. It is a software-as-a-service (SaaS) infrastructure model that supports many applications, including Apache Cassandra, continuous profiling, and distributed tracing.
There are several connectors available for use with Datadog, particularly options using Apache technologies such as Apache Cassandra. After modifying the product configuration according to your requirements, you can leverage the appropriate database, runtime environment, and system software parameters for visualization and correlation.
It is impossible to constantly monitor the performance and health of the entire database. But you don’t need to worry, because Datadog sets performance thresholds for each parameter and notifies you when the threshold is exceeded.
Additionally, you can customize your dashboard with the most important parameters and indicators.
Features:
- Over 500 fully managed plugins help you monitor Apache Cassandra databases, network metrics, application footprint, and virtual machine activity in one place.
- Real-time visualization of actionable information and configurable parameters
- Analyze response streams quickly using a simple log analysis framework and automated pattern recognition.
- Users can use deductive algebra to set up hybrid alerts and save time responding to false reports.
- Easily identify downward Cassandra requests and data constraints with edge application monitoring and comprehensive delay partitioning.
- Quickly create customized drag-and-drop data visualization charts.
Datadog is indeed a subscription-based service, and the service is divided into different monitoring components. Each component of the system is charged individually, either periodically or on demand. On-demand payments increase the price of your product by approximately 17-20% over the annual price.
All modules are available with a 14-day free trial without any restrictions. Download a personalized demo or request one from a Datadog developer.
AxonOps
AxonOps is the only product built from the ground up for Apache Cassandra. It uniquely combines all of Cassandra’s monitoring and operational requirements within one intuitive UI. This is achieved through a highly efficient bidirectional protocol that combines pulling data and pushing operations from a single agent.
Adaptive remediation is an example of how AxonOps leverages data pull to operate smarter. Every Cassandra expert knows how difficult it is to maintain an effective Cassandra remediation strategy. AxonOps ensures that remediation is always on and runs only when the remediation process does not impact the cluster’s capacity demands.
Features:
- Visualize metrics and logs with dynamic dashboards
- Proactive service checks to ensure you don’t miss any issues
- Comprehensive alerts with enterprise-wide integration
- Adaptive and scheduled Cassandra remediation to stay one step ahead
- Maintenance job scheduler to automate key tasks
- Detailed cluster configuration view to get the insights you need
- Scheduling backups
- Visualize backup and restore
- Restore backups with confidence
AxonOps is a subscription-based service with a simple single-agent installation that allows you to connect your cluster in minutes. The first 5 nodes are available for free and allow you to test drive AxonOps within your own Apache Cassandra Sandbox environment.
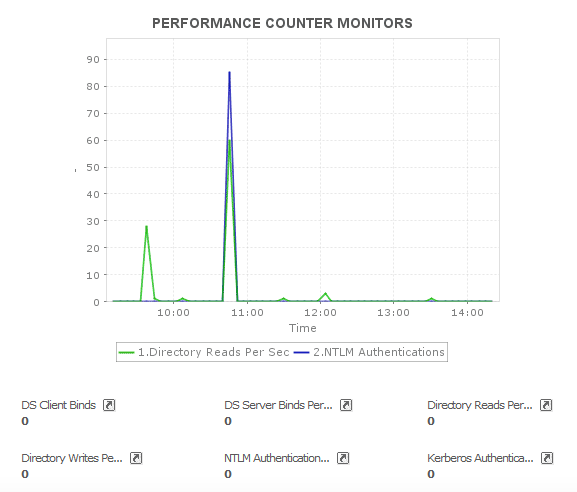
Engine management
ManageEngine Applications Manager provides comprehensive network monitoring, innovative digital monitoring, and more. ManageEngine Application Manager is a monitoring solution that integrates with Apache Cassandra. Monitor database performance.
In addition to monitoring, Cassandra functionality and performance are also displayed in various behavioral graphs. These infographics also display disk space information and CPU load.
This tool can track the frequency of running, outstanding, and delayed processes, and also tracks multiple Cassandra threads. Additionally, careful monitoring of misplaced transactions can help manage overflow situations in your Cassandra infrastructure.
You can set threshold levels, create alarms to notify you of failed transactions, and get a log summary of lost data including content types. The dashboard was created specifically to allow users to track deployed nodes and also provides a category breakdown of each node’s status.
Features:
- Easily monitor Cassandra working in different environments
- Automatically recognize databases, dedicated servers, and other network devices.
- Alert mechanisms are available to support notifications.
- It also provides a log monitoring service that tracks external factors such as resource usage and cache consistency, giving you a complete picture of the health of your database.
You can choose to install the Professional or Corporate version. If you do not register for a business license before your one-month free trial expires, the software will automatically revert to the free version with limited functionality.
sema text
Sematext provides full-stack insights for businesses by quickly uncovering possible errors and system failures using an on-demand cloud platform. Sematext is easy to configure and provides comprehensive visibility into your IT environment. This includes monitoring Apache Cassandra.
It is a reliable solution that provides superior tracking for Apache Cassandra deployments, developed by combining effective reporting mechanisms with anomalous activity recognition that supports a variety of metrics.
A cloud-based management service that helps businesses and organizations manage log data, tracking systems, and more on a unified platform. Database indicators and OS statistics can be fully monitored on the Sematext platform.
Once the tool is deployed in a working environment, it will ultimately receive an analysis of Apache Cassandra and the equipment it utilizes, including the container platforms and bare virtual machines that Apache Cassandra uses. Then you get a pre-built overview for each important set of parameters.
Features:
- In addition to Apache Cassandra statistics, it provides complete transparency into your environment through tracking and analysis of connections, data systems, and network equipment.
- Provides robust charting tools for visualizing almost any data from Sematext.
- Alerts based on anomalous activity recognition and compatibility with third-party notification systems
- Systematic reporting and regular maintenance.
- It supports configurable monitoring, allowing users to track performance issues and errors that may occur.
Metrics analysis is available in a dynamic context based on virtualization technology and is adaptive and billed by the hour, making it easy to scale resources up or down to meet the needs of your enterprise.
Pricing is determined by the size of the host or container platform being monitored. Like other tools, SemaText also offers a 14-day free trial.
new relic
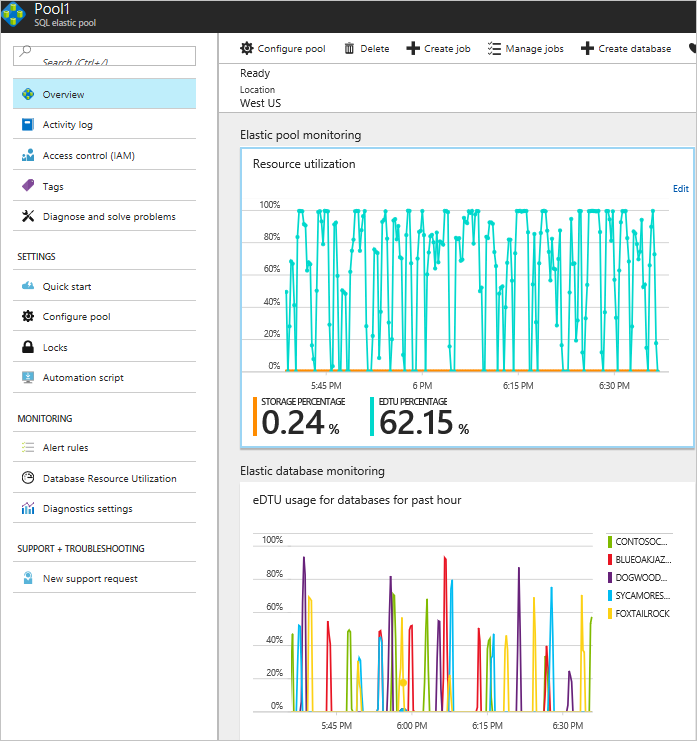
New Relic is a SaaS cloud service model and edge monitoring solution that supports Apache Cassandra integration. Easily create a monitoring gateway for your entire environment using a variety of interconnected layouts and components. When integrated with alert systems and NRQL (New Relic Query Language), this software supports everything you need to keep tabs on Apache Cassandra.
Retrieving data and enabling built-in monitoring mechanisms is possible through this query language. Apache Cassandra is compatible with the most well-known cloud service providers such as IBM Cloud, AWS, Microsoft Azure, and GCP , making it easy to monitor with common service models.
Features:
- Consolidating and analyzing logs allows you to provide reporting in addition to Cassandra metrics.
- Outlier detection and synchronized alerts.
- Analyze application performance metrics while providing full Cassandra support through dashboards.
Pricing is determined strictly based on the number of users and their privileges. Available features and the amount of data a user can send at no additional charge vary depending on the subscription type (Standard, Professional, or Corporate).
For example, a typical subscription allows users direct access to certain features such as network monitoring, cloud-based monitoring, etc. while only allowing up to 5 users.
insta cluster
Instaclustr provides fully managed services for Apache Cassandra. The preinstalled Cassandra Monitoring API tracks the amount of disk space consumed, CPU time, delayed tasks and incomplete constraints, and more.
Users can track the progress of parameters over time using built-in visualization tools. For example, you can use the graphing mechanism to examine changes in propagation delay over time. These infographics help you quickly see patterns that might be missed by dashboards.

This dedicated, monitored service allows you to put data infrastructure concerns aside and focus on developing the rest of your architecture systems.
Features :
- Users can closely monitor server resource usage and generate reports.
- Very reasonable and transparent pricing for service infrastructure.
- You can effectively manage your infrastructure with multiple clusters.
- Each measure is updated frequently to ensure that the data displayed is accurate.
A fully functional free trial version is available. You can also find the right plan for your infrastructure by selecting your application and service provider on our pricing page and reviewing the associated costs.
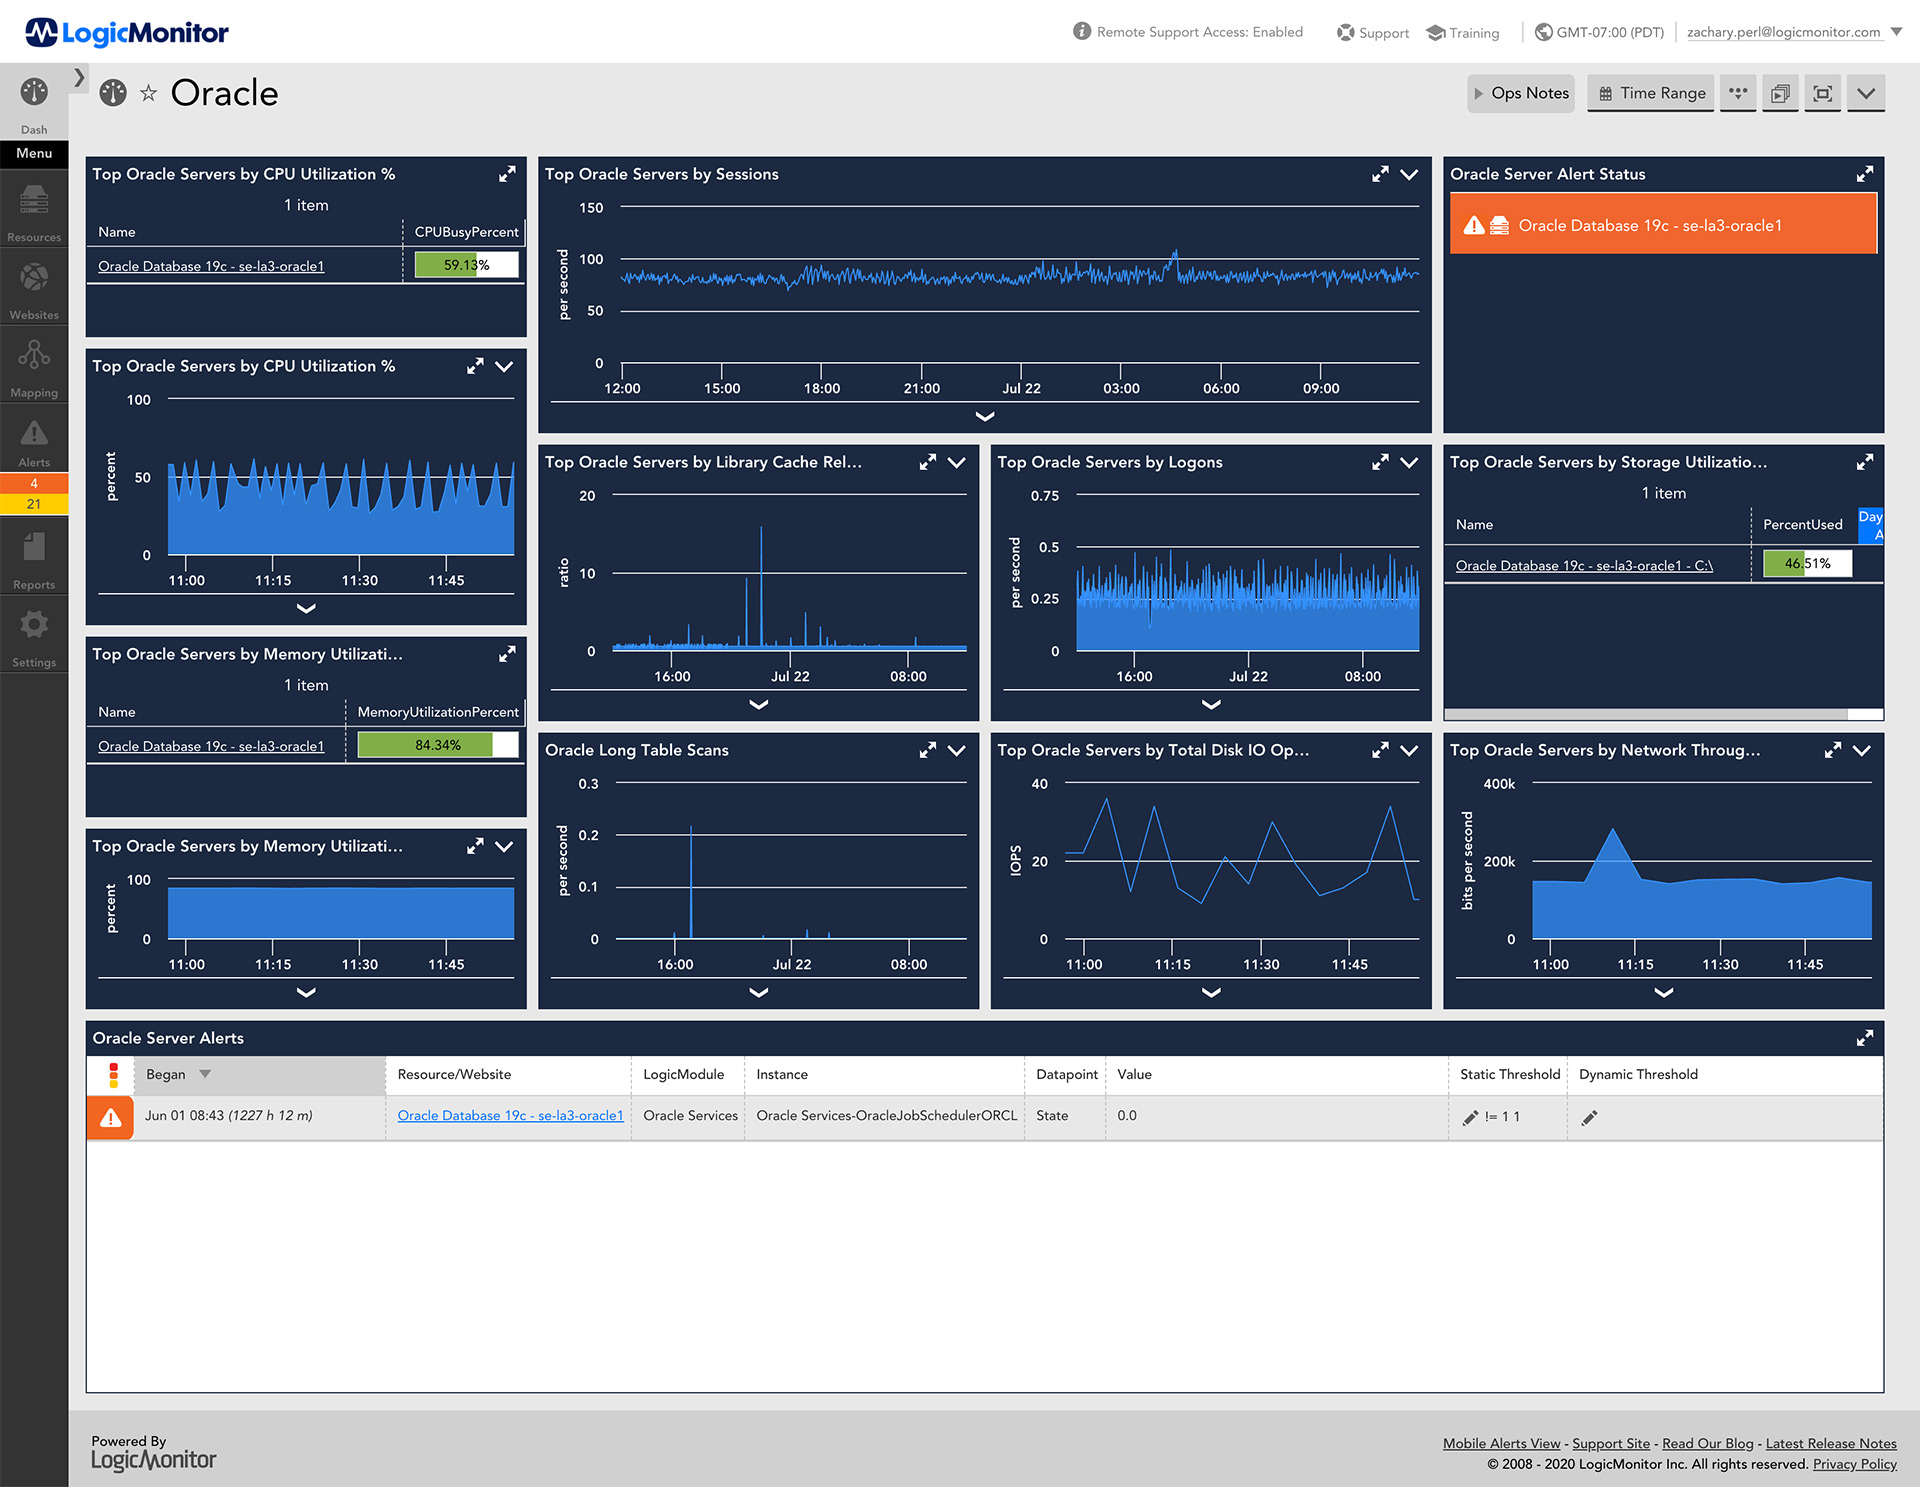
dyna trace
Dynatrace is also a great monitoring application that allows you to instantly recognize your Cassandra database and start tracking its performance. Deploy Dynatrace monitoring tools to analyze complex application environments.
This tool provides broader context of the complete application architecture, including metrics for variable functionality, network equipment, and customer engagement. Provides a user-friendly mechanism for monitoring architecture, data systems, and records. Applications can be automatically discovered, resolved, and streamlined.
You can also monitor various statistics such as CPU usage, connections, pauses, and packet loss. One of Dynatrace’s best features is its ability to assess root problems. Dynatrace can highlight performance issues on a specific node by uncovering the root cause.
With all the data you need at your fingertips, you can streamline root cause investigations and handle server issues faster.
Features:
- Automatically identify Cassandra databases
- It has a built-in root cause analysis mechanism to discover the root cause of the problem.
- Adaptive and dynamic dashboard
- Apache Cassandra statistical measurements are compatible when using popular cloud providers such as GCP, IBM Cloud, and AWS.
- Users can quickly identify issues, their impact on the organization, and root causes with assistance.
Dynatrace is the product to consider if you want a simple Cassandra monitoring solution that is easy to deploy and transparent across nodes down to the root level. It is based on a SaaS cloud service model and services can be acquired on a pay-as-you-go basis. Additionally, a 15-day free trial is also available.
conclusion
Cassandra monitoring is necessary for stable database operation and task processing. It’s important to constantly monitor Cassandra performance to discover defects, identify errors, and act quickly to resolve issues.
We hope this article helped you learn about the best Apache Cassandra monitoring tools to track database performance.
You might be interested in learning about the top open source database software for your next project.


![How to set up a Raspberry Pi web server in 2021 [Guide]](https://i0.wp.com/pcmanabu.com/wp-content/uploads/2019/10/web-server-02-309x198.png?w=1200&resize=1200,0&ssl=1)

")


 in Roblox")
")


")


")


")
