If you find flowchart symbols a little confusing, read this ultimate guide to flowchart symbols and you’ll become a master flowchart maker in no time.
Business and academic teams primarily use flowcharts to visualize complex processes in an easy-to-understand layout.
Flowcharts have been used in business and academic systems since 1921, when Lillian Gilbreth and Frank Gilbreth introduced this process visualization tool to the American Society of Mechanical Engineers (ASME).
However, all flowchart authors face a common challenge when implementing some symbols for flowcharts. Your flowchart won’t look professional if you don’t use standardized symbols.
This article describes most flowchart symbols used in various diagramming and process visualization projects. You will also learn the basics such as its definition and work process. Let’s read on!
What is a flowchart?
A flowchart is a visual diagram that shows a system, business workflow, computer algorithm, or process. You may already be using flowcharts to perform a variety of tasks, such as documenting, planning technical or non-technical systems, creating research plans, improving existing processes, and communicating ideas.
This is the most popular tool that explains difficult methods and routes in easy-to-understand charts that anyone inside or outside the domain can understand.
Flowcharts basically use ovals, squares, diamonds, rectangles, and many other shapes to specify different steps in a process or workflow. In addition to these symbols, you must also define sequences or flows using flow lines or arrows as connecting links between symbols.
Just as flowcharts use several symbols and sequence drawing conventions, they can also have a variety of designs, including complex computer-generated flowcharts with many sequences, or hand-drawn flowcharts with a simple one sequence. can.
An interesting fact about flowcharts is that they are common in non-technical and technical fields. For example, visual artists and software developers can use flowcharts to plan their projects.
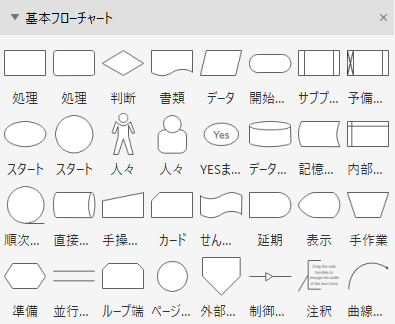
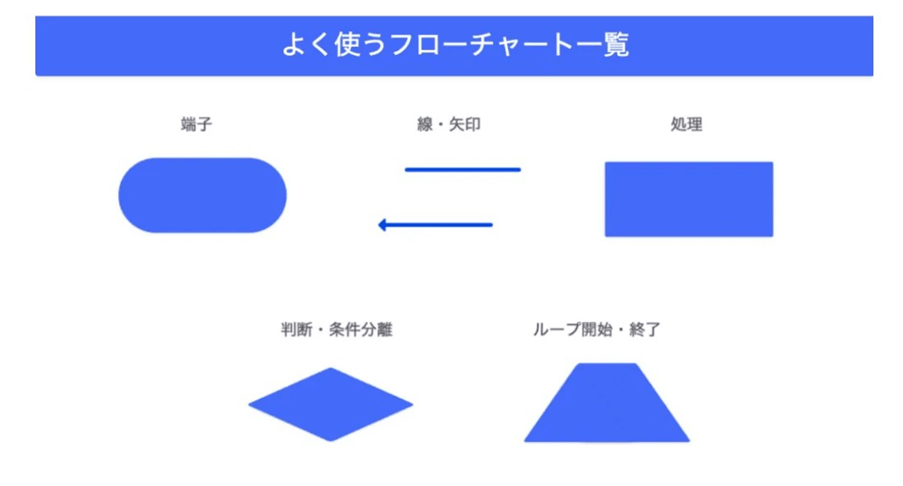
Common flowchart symbols
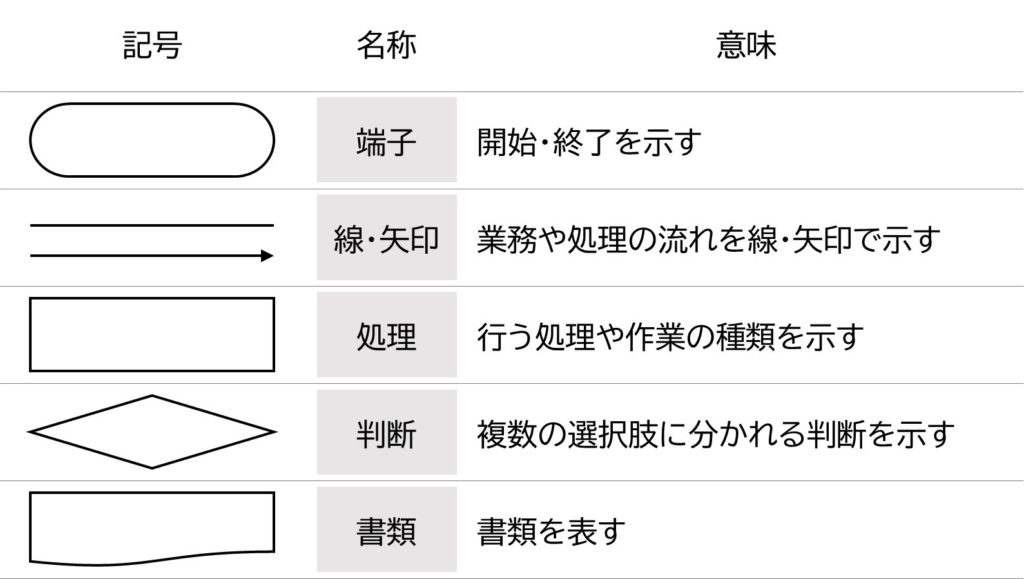
beginning and end

Use terminal symbols to start and end your flowchart. It looks like a pill or an oval button. Start and End may often be written inside the terminal symbol.
This shape also represents the results of the flowchart sequence. If you are drawing a complex flowchart, there may be multiple start and end symbols.
input/output

The data input and output symbols are essentially parallelograms. This symbol should be used to represent data entering and leaving the system.
For example, a customer purchasing a product is input data, and shipping that product from a warehouse is output data. In some cases, Yes/No and True/False can be used to describe computer algorithms.
manual input
If your process or algorithm requires the user to enter data for subsequent flows in the process, you should use the manual entry flowchart symbol.
You can use any trapezoid for this. This symbol can be used when customers need to enter login credentials, payment information, etc.
arrow
Arrows or flow lines connect all the steps in a flowchart, such as starts, actions, inputs, outputs, manual inputs, decisions, loops, and documents.
When you use a solid line, it means that data flows from one symbol to another. If you use a dashed line, it is an alternative to another route. Finally, you can use parallel lines to specify that data flows synchronously from one step to another.
action/process
Rectangles represent all actions or processes in a flowchart. Different fill colors can be used to organize different processes into subgroups.
A process symbol always means that a particular task is completed in this phase, after which the flowline enters the next symbol, which means the progression of the flowchart.
decision

The decision symbol is a diamond-shaped button on the flowchart. The flow lines from the previous step enter one chip, and the other three flow lines flow from the other chip to another process. This means that changing a decision activates another process flowline.
For algorithms, the decisions are Yes/No and True/False. In most cases, there are questions that need to be answered in order to make a decision.
document
The document symbol resembles a rectangle with a wavy curve on one side. This is also a flowchart I/O symbol. In a process map, use this shape when you need to mention the inputs of a document or report that provide a specific output.
multiple documents
This is similar to the flowchart symbol above named Document. However, the only difference is that the symbol visualizes multiple documents stacked like folders in a file cabinet.
This symbol can be used where multiple document inputs are required. You can also use this symbol if your process produces a large number of documents.
connector

If your flowchart is complex and requires multiple sequence connections for continuation, you should use connector symbols. It’s a simple circle. It is also popular as an on-page connector because it connects symbols and sequences on one page.
To connect symbols or sequences from different pages, you can use right-angled isosceles pentagons. Also called link symbol.
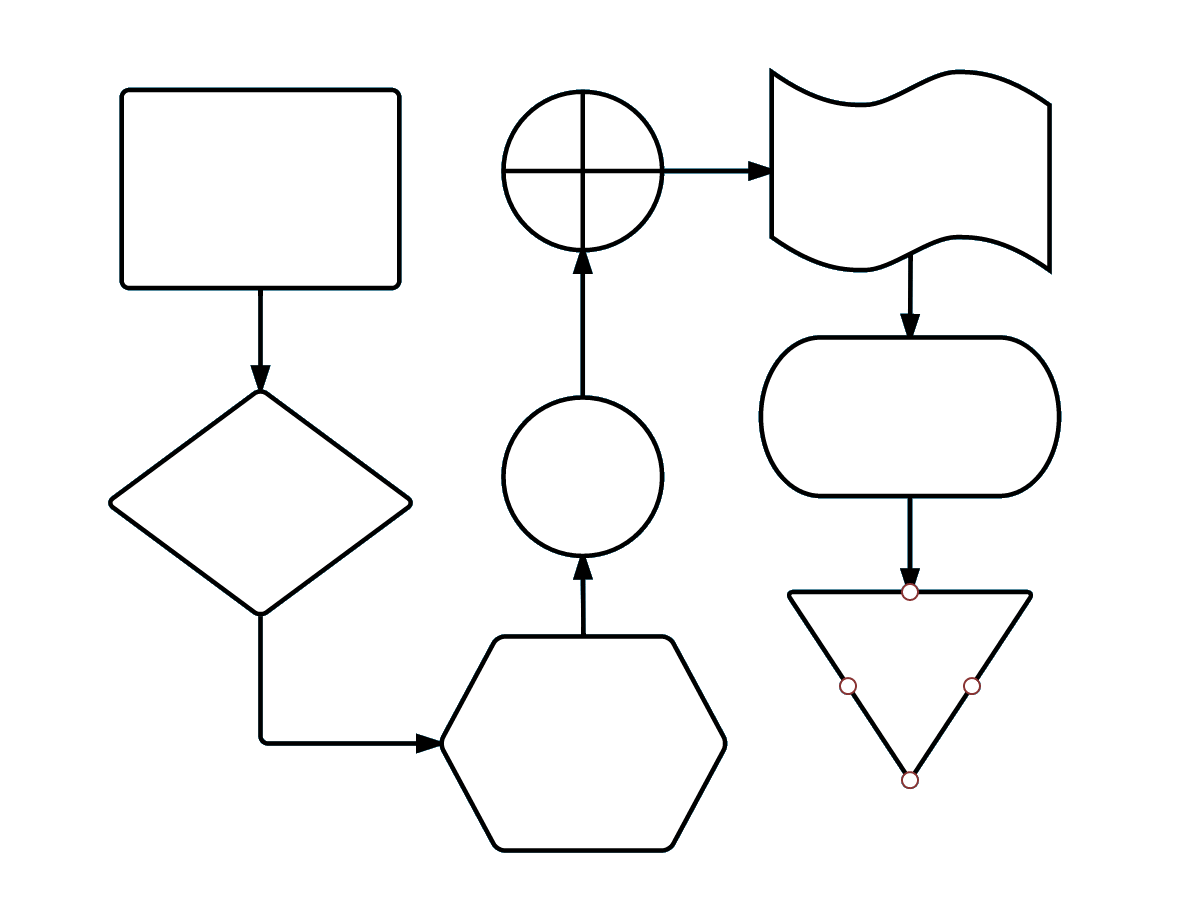
preparation

The preparation or initialization symbol distinguishes between steps that perform work and steps that prepare for future work.
This hexagon symbol should be used if you want to introduce setup steps before continuing with the workflow. For example, in a DevOps project, a new software package must first be deployed before the testing phase can begin.
merge

You can use merge to indicate a step that combines two or more lists and processes. This merge symbol looks like an inverted triangle or funnel where multiple workflow branches are combined into one.
sorting
When people need to indicate that information must be arranged in a certain order according to predetermined criteria, they use sorting symbols that resemble the shape of a diamond.
For example, use it to classify product colors based on customer requirements before moving to manufacturing steps.
subroutine
The symbol for a predefined process or subroutine looks like a rectangle. You can use this to show fully documented steps in a separate flowchart.
Even if the subprocess is known to team members, do not use this symbol unless the process is defined elsewhere.
loop

There are two types of loop symbols that can be used in flowcharts: manual loops (rectangular shape) and loop limits (house-like shape). The first shows the command sequence that repeats until you manually stop it, and the second shows where to stop the loop.
delay
If you expect a delay somewhere in your process workflow, you can insert one or more delay symbols. The delay symbol is a semi-elliptical symbol. A delay between two actions or symbols means that certain tasks must be completed during the delay period before the flowchart can proceed further.
storage
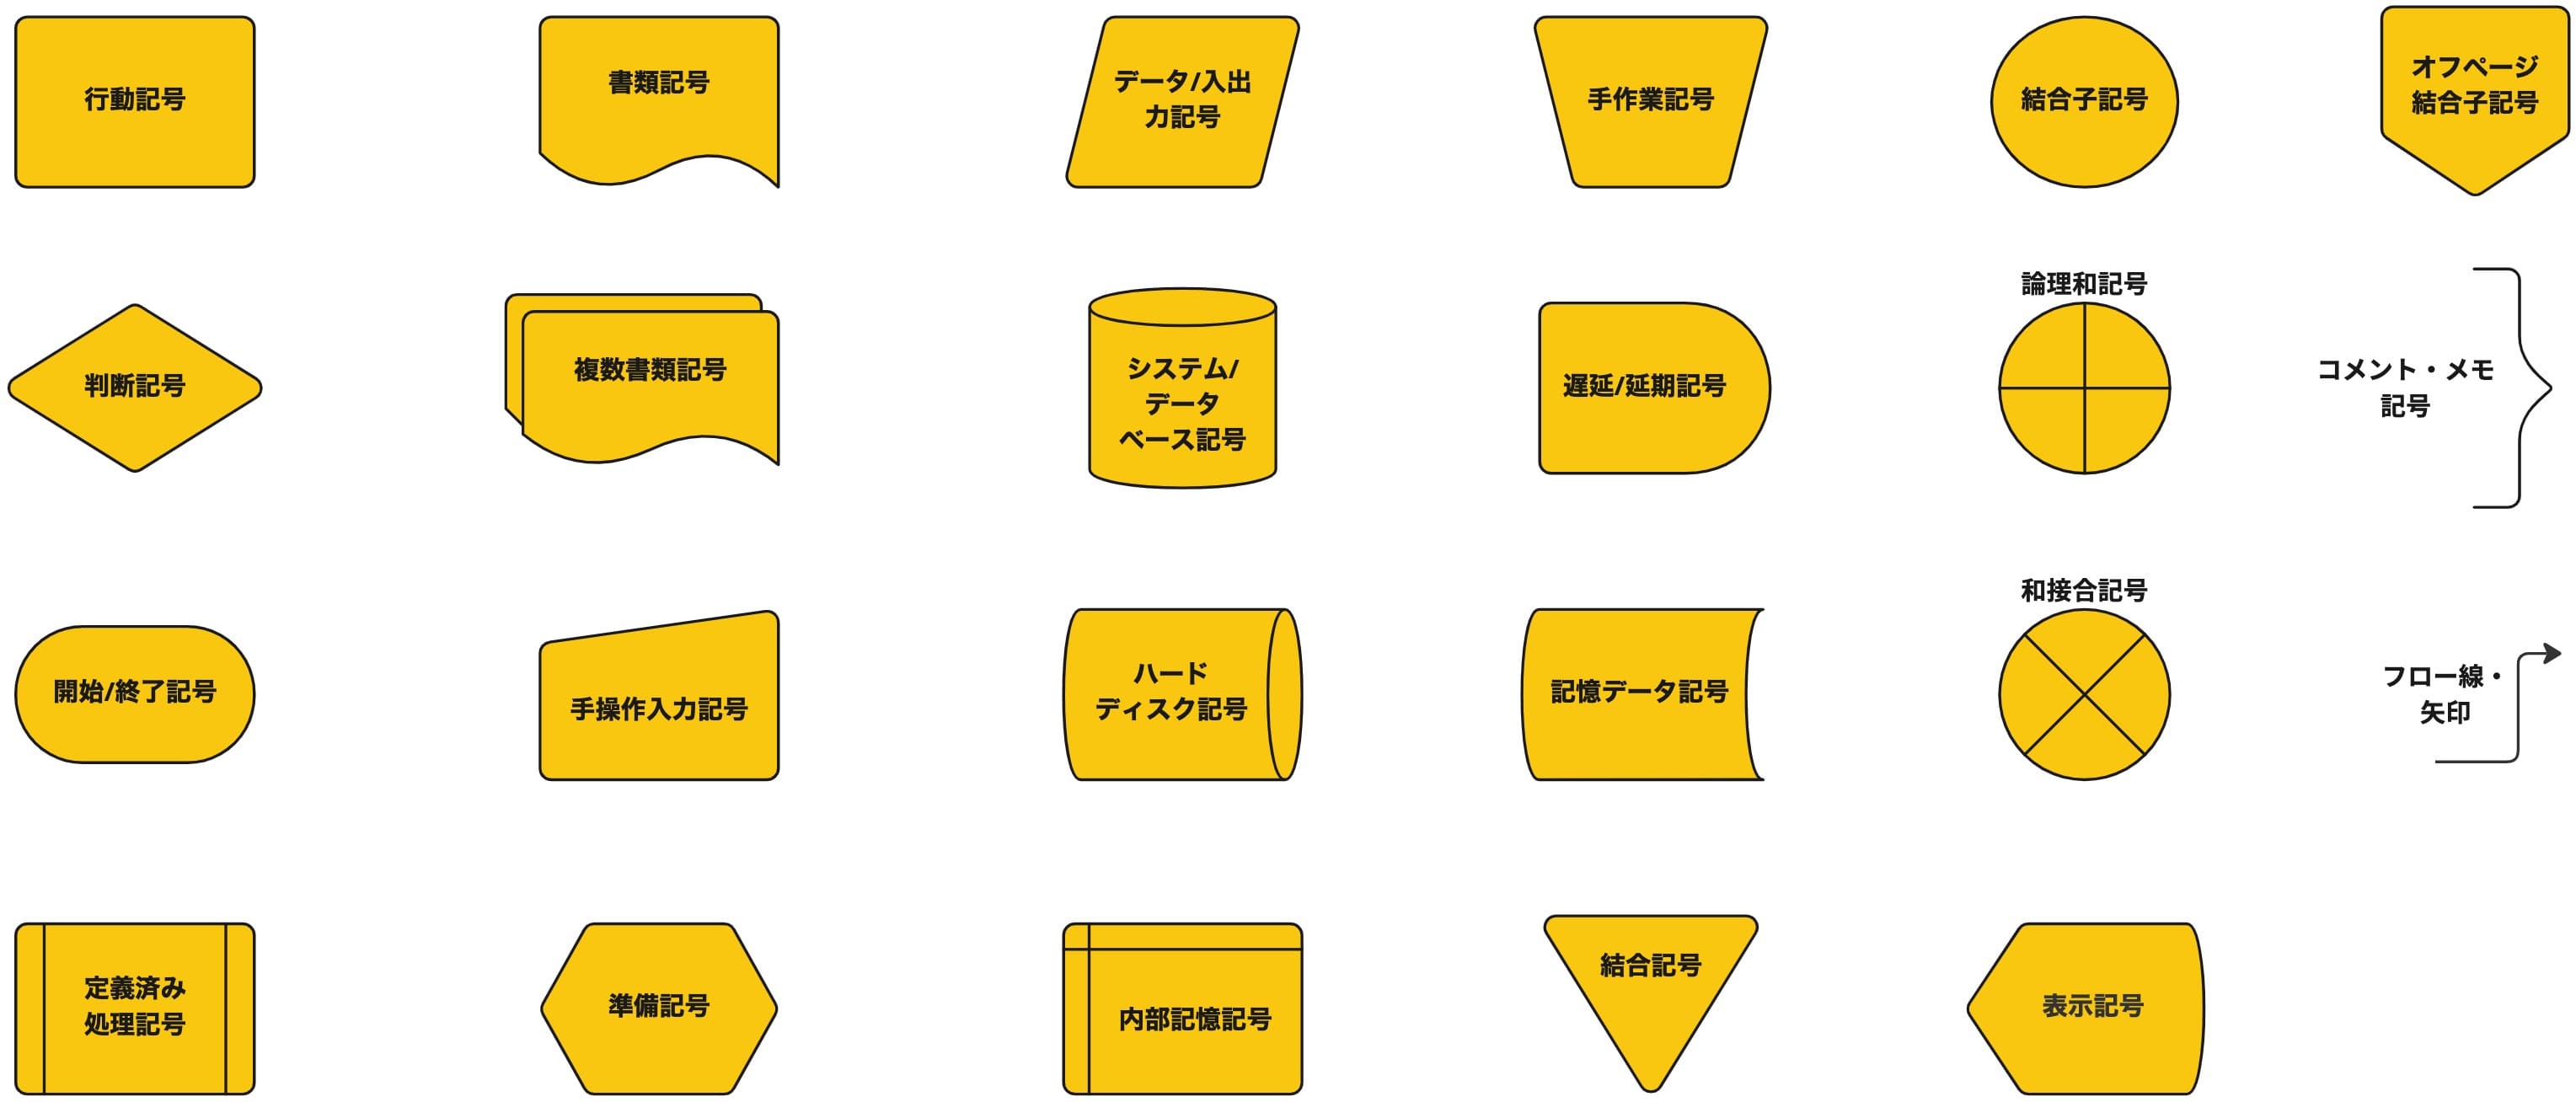
There are two storage-related symbols in this flowchart. The data storage or data preservation symbol looks like a cylinder cut in half and shows the steps involved in saving data.
However, the internal storage symbol looks like a square and is primarily used in software development flowcharts. This means that data is stored in memory during programming.
database
It resembles the shape of a magnetic disk, which is recognized worldwide as a symbol of databases. Use it to represent data stored on a storage device that supports user search, sorting, and filtering.
Now that you’ve learned about trend symbols in flowcharts, check out how this visual chart concept works below.
How do flowcharts work?
Flowcharts work by visualizing any process on a two-dimensional canvas, whether on paper or digitally. Charts usually start with a starting symbol.
Then add different symbols according to the process, connect the symbols with flow lines, and finally reach the decision or stop process symbol.
If a flowchart defines a single process, it is a simple flowchart. However, most of the actual flowcharts used by companies are complex because there are many interconnected sequences before the final decision.
This is just an oversimplified explanation of how flowcharts work. More concepts and logic are used. For example, changing the type of flowchart changes the drawing rules as well as the way the flowchart is read.
For a better understanding, start by looking at the most common types of flowcharts below.
- Flowchart documentation, approval, processing, and archiving
- Data flow or processing flowchart
- System flowchart
- Program flow chart
- Decision or Justification Flowchart
- Risk management logic flowchart
- Product development flowchart
- Process result flowchart
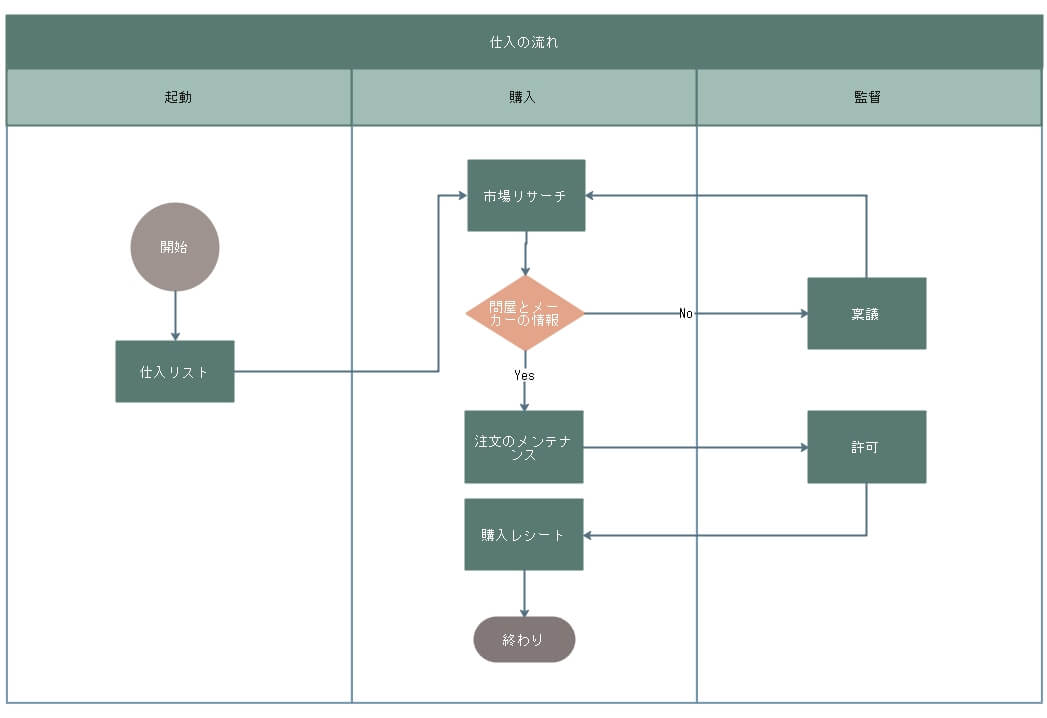
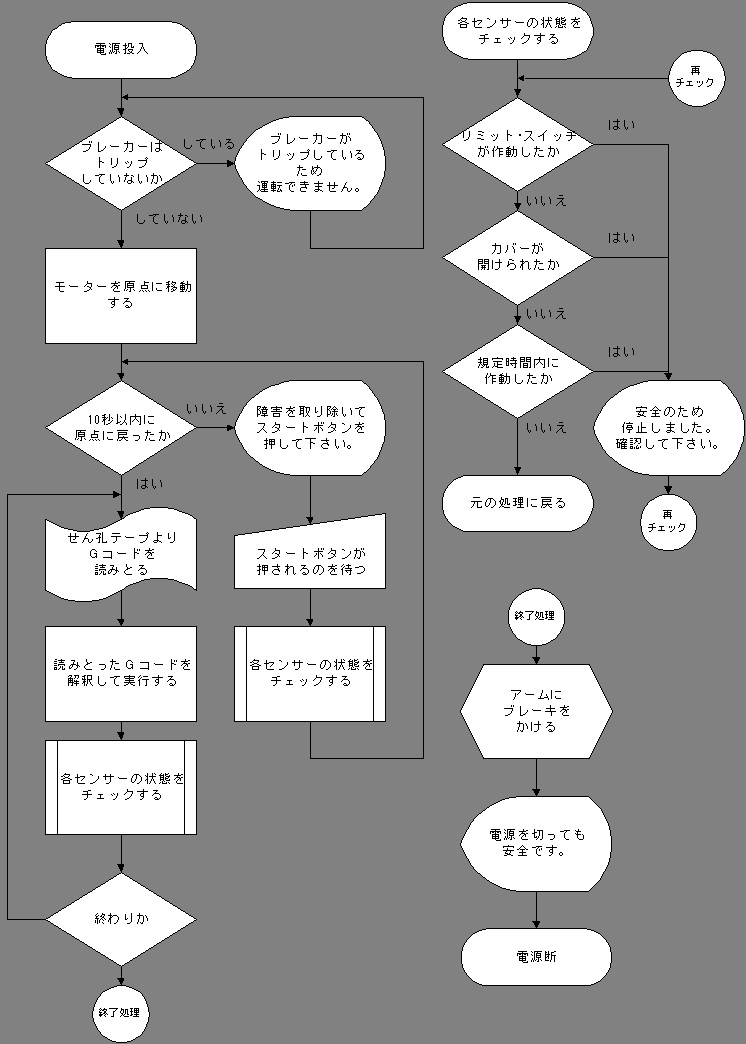
Now, consider the flowchart of the document from the list above. It visualizes several controls on a document processing workflow using various flowchart symbols such as start, input, output, manual input, action, prepare, join, match, loop, delay, save, exit, etc. It works by:
The final diagram should be drawn from left to right, and the audience should also read in this direction.
Additionally, when you create a flowchart according to the standard rules for flowcharts, the following occurs:
#1.Identification of tasks

Before you start your flowchart, you need to identify all your tasks and write them down in one notepad. So, apart from drawing a visual process of your technical or non-technical ideas, you will also get a rough project timeline.
#2.Organize process elements
The flowchart also organizes all the materials and resources your team will use once the project begins.
#3.Edit information
Moreover, it also helps you directly compile all the data needed to draw the process in flowchart tools.
#4.Confirm process flow
This allows you, your team, and business stakeholders to collaboratively review every step, control, flow, sequence, and more before writing the first draft.
#5.Convert tasks to shapes
A flowchart is essentially a transformation of process steps in a visual cue. Use related shapes to represent specific steps, such as a customer purchasing a product, generating an order, entering an order, reviewing an order, or checking inventory.
#6.Improvisation
After the first draft, the team can participate in another meeting and improvise the entire flowchart. This phase also discovers unknown bottlenecks in the project.
#7. communication
Finally, communicate your plan concisely and visually to your audience.
Creating flowcharts manually is a difficult task. The project will be delayed. It is wise to use online tools to create flowcharts. Most of these tools come with all the flowchart symbols you’ll need.
Web app for creating flowcharts
Milo
Miro is a flowcharting tool that offers a combination of speed and simplicity. Whether you want to create a flowchart for the daily operations of your project’s workflow, the platform has templates for every use case.
Create charts like a pro with icon sets, color-coded dependencies, and link embedding features.
creatively
Creately is a reliable option when it comes to visualizing processes and workflows. It includes features such as automatic drawing and a drag-and-drop interface to quickly create flowcharts.
Choose from over 1000 custom templates to get your project started. Additionally, video conferencing and live mouse tracking are available for real-time collaboration.
lucid chart
Lucidchar t helps you create flowcharts with several features such as customized shapes, data import, etc. In addition to its simple interface, it also features a dynamic flowchart shape library consisting of all the shapes, symbols, and swimlane containers you need.
Additionally, users can take advantage of advanced flowchart features such as conditional formatting, action buttons, data links, and external links.
last word
Using appropriate symbols in your flowchart shows that you understand the concept thoroughly. If you don’t insert the appropriate symbols, your business stakeholders, clients, or audience may not like your process flowchart.
Now you have a complete list of flowchart symbols that you must use every time you create a flowchart in the future. This article also explained how flowcharts work so you can create professional-looking flowcharts that your audience will want to read.
You may also be interested in starting, stopping, and continuing retrospectively for process improvement.


![How to set up a Raspberry Pi web server in 2021 [Guide]](https://i0.wp.com/pcmanabu.com/wp-content/uploads/2019/10/web-server-02-309x198.png?w=1200&resize=1200,0&ssl=1)

")


 in Roblox")
")


")


")


")
