Learn the basics of Grafana Loki, a multi-tenant log aggregation system.
In a production environment, downtime is unacceptable. This can result in significant losses to your business’s revenue and reputation. However, with a proper logging and monitoring system in place, you will know how to debug such scenarios that lead to downtime.
It helps you save money and identify potential problems in the future.
Organizations of all sizes are now using DevOps principles and tools. Containers and Kubernetes are the most popular. Monitoring such systems is done very efficiently using Prometheus. But where Prometheus lags is in the logging part. This is where Loki comes in, as there is no centralized logging system provided.
What is Grafana Loki?
Grafana Loki is a multi-tenant log aggregation system launched by Grafana in 2018 and released under the Apache 2.0 license. This system was inspired by Prometheus. It is primarily used by cloud providers and tools such as Prometheus and Grafana.
Loki is similar to the ELK/EFK stack, but is easier to set up and operate, and has better functionality. Loki does not index the contents of the log, it indexes a set of log stream timestamps and labels. This results in smaller indexes, simpler operations, and ultimately lower costs.
Loki’s Advantages
The benefits of using Loki in your stack are:
- Because it indexes only metadata, Loki is very cost-effective. Running the index for full-text processing requires a large RAM instance, which is very expensive. Storing logs in stored objects like S3 is much cheaper.
- Supports multi-tenancy using tenantID, allowing tenants to store data separately.
- You can run Loki locally for small-scale operations, or easily scale it horizontally for large-scale operations.
- Use dynamo style to ensure quorum consistency for read and write operations.
- By default, it is configured to have three replicas of the log to address the risk of a process crashing or dying unexpectedly resulting in log loss. Yes, there will be some additional costs, but they are not that expensive. Data integrity is more important.
- Easily connect with popular tools like Kubernetes, Prometheus, and Grafana visualizations.
Loki’s architecture
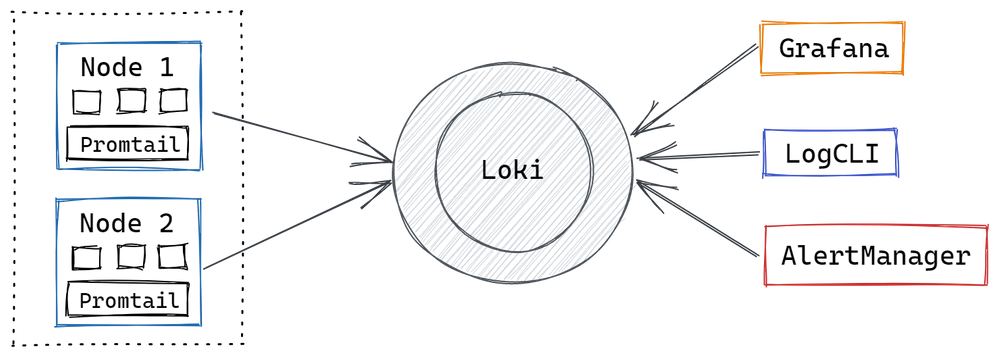
The Loki architecture has three components: Promtail , Loki , and Grafana .
Promtail is an agent that must be installed on each node running an application or service. Promtail’s primary role is to discover targets, label LO streams from pods, and push those logs to Loki instances. Agent promtail tracks logs from the local file system and pushes them to Loki’s central server. After this, you can query back the logs using Grafana.
Loki usage examples
Below are some common use cases for using a logging system like Loki.
- Business Intelligence: This is an evergreen use case and creating actionable insights from log data is always very useful. Loki helps you understand your log data so you can create new strategies for business growth. For example, your organization’s log data can help you understand conversion rates from advertising channels.
- Monitoring: Prometheus is commonly used in industry for monitoring. However, you can determine a lot by monitoring your logs using tools like Loki. It helps you monitor your website’s error rate by examining your logs and sending alerts when thresholds are exceeded.
- Debugging and troubleshooting: Loki helps DevOps teams with easy answers such as when the app crashed, why it crashed, and its last status before the crash.
- Cyber Security : Over the past few years, there has been a sharp increase in cyber attacks against e-commerce portals. Loki allows you to review logs to identify threats, issues, and malicious activity occurring within your organization’s systems. Even in the case of a successful hack, Loki could help forensic teams understand in detail what happened within the system. It helps in tracking hackers.
- Compliance: To comply with industry regulations, organizations must retain audit logs for up to seven years. Local authorities can audit logs at any time. Loki can store audit logs securely.
Installing Loki and Promtail
Let’s take a quick look at how to install and visualize logs in Grafana. This demo uses a typical configuration that collects logs from /var/log/*log .
If you go to the Loki release page and scroll down to Assets, you’ll find multiple Loki and Promtail packages here. Download the Loki package depending on your system. Do not download the cli or Canary Loki packages. I am downloading loki-linux-amd64.zip and promtail-linux-amd64.zip for my Ubuntu system.
Once the download is complete, extract the Loki and Promtail files and place them into a single directory.
 @:~$ mkdir loki
@:~$ mv loki-linux-amd64 promtail-linux-amd64 loki
@:~$ cd loki/
@:~/loki$ ls
loki-linux-amd64 promtail-linux-amd64
Now download the generic configuration files for Loki and Promtail .
 @:~/loki$ wget https://raw.githubusercontent.com/grafana/loki/master/cmd/loki/loki-local-config.yaml
--2021-04-30 12:00:51-- https://raw.githubusercontent.com/grafana/loki/master/cmd/loki/loki-local-config.yaml
Resolving raw.githubusercontent.com (raw.githubusercontent.com)... 185.199.111.133, 185.199.110.133, 185.199.109.133, ...
Connecting to raw.githubusercontent.com (raw.githubusercontent.com)|185.199.111.133|:443... connected.
HTTP request sent, awaiting response... 200 OK
Length: 1832 (1.8K) [text/plain]
Saving to: ‘loki-local-config.yaml’

loki-local-config.yaml 100%[===============================================================================================>] 1.79K --.-KB/s in 0s

2021-04-30 12:00:51 (16.6 MB/s) - ‘loki-local-config.yaml’ saved [1832/1832]
@:~/loki$ wget https://github.com/grafana/loki/blob/main/clients/cmd/promtail/promtail-local-config.yaml
--2021-04-30 12:05:07-- https://github.com/grafana/loki/blob/main/clients/cmd/promtail/promtail-local-config.yaml
Resolving github.com (github.com)... 13.234.210.38
Connecting to github.com (github.com)|13.234.210.38|:443... connected.
HTTP request sent, awaiting response... 200 OK
Length: unspecified [text/html]
Saving to: ‘promtail-local-config.yaml’
promtail-local-config.yaml [ <=> ] 109.16K --.-KB/s in 0.002s
2021-04-30 12:05:08 (66.8 MB/s) - ‘promtail-local-config.yaml’ saved [111779] @:~/loki$ ls
loki-linux-amd64 loki-local-config.yaml promtail-linux-amd64 promtail-local-config.yamlTo start Loki, run the following command using the Loki configuration file: This will start Loki and display the Loki logs in your terminal.
 @:~/loki$ ./loki-linux-amd64 -config.file=loki-local-config.yaml
level=info ts=2021-04-30T16:08:37.990311491Z caller=main.go:130 msg="Starting Loki" version="(version=2.2.1, branch=HEAD, revision=babea82e)"
level=info ts=2021-04-30T16:08:37.990856871Z caller=server.go:229 http=[::]:3100 grpc=[::]:9096 msg="server listening on addresses"
level=info ts=2021-04-30T16:08:37.991613443Z caller=shipper_index_client.go:100 msg="starting boltdb shipper in 0 mode"
level=info ts=2021-04-30T16:08:37.992568288Z caller=mapper.go:38 msg="cleaning up mapped rules directory" path=/tmp/loki/rules-temp
level=error ts=2021-04-30T16:08:37.992623632Z caller=mapper.go:42 msg="unable to read rules directory" path=/tmp/loki/rules-temp err="open /tmp/loki/rules-temp: no such file or directory"
level=info ts=2021-04-30T16:08:37.993520927Z caller=table_manager.go:171 msg="uploading tables"
level=info ts=2021-04-30T16:08:37.993941099Z caller=module_service.go:59 msg=initialising module=store
level=info ts=2021-04-30T16:08:37.994011839Z caller=module_service.go:59 msg=initialising module=memberlist-kv
level=info ts=2021-04-30T16:08:37.99412775Z caller=module_service.go:59 msg=initialising module=server
level=info ts=2021-04-30T16:08:37.994379648Z caller=module_service.go:59 msg=initialising module=ingester
level=info ts=2021-04-30T16:08:37.994415984Z caller=ingester.go:241 msg="recovering from checkpoint"
To start Promtail, run the following command using the Promtail configuration file. Promtail is required to get logs to Loki.
 @:~/loki$ ./promtail-linux-amd64 -config.file=promtail-local-config.yaml
level=info ts=2021-04-30T16:35:52.775998059Z caller=server.go:229 http=[::]:9080 grpc=[::]:42557 msg="server listening on addresses"
level=info ts=2021-04-30T16:35:52.776283661Z caller=main.go:112 msg="Starting Promtail" version="(version=2.2.1, branch=HEAD, revision=babea82e)"
level=info ts=2021-04-30T16:35:57.776226323Z caller=filetargetmanager.go:254 msg="Adding target" key="{job=\"varlogs\"}"
ts=2021-04-30T16:35:57.776902427Z caller=log.go:124 level=info msg="Seeked /var/log/fontconfig.log - &{Offset:11055 Whence:0}"
level=info ts=2021-04-30T16:35:57.776983546Z caller=tailer.go:125 component=tailer msg="tail routine: started" path=/var/log/auth.log
level=info ts=2021-04-30T16:35:57.777009023Z caller=tailer.go:125 component=tailer msg="tail routine: started" path=/var/log/fontconfig.log
ts=2021-04-30T16:35:57.777094698Z caller=log.go:124 level=info msg="Seeked /var/log/lastlog - &{Offset:0 Whence:0}"
ts=2021-04-30T16:35:57.777712594Z caller=log.go:124 level=info msg="Seeked /var/log/apport.log - &{Offset:0 Whence:0}"
ts=2021-04-30T16:35:57.778200383Z caller=log.go:124 level=info msg="Seeked /var/log/alternatives.log - &{Offset:456 Whence:0}"
ts=2021-04-30T16:35:57.780467419Z caller=log.go:124 level=info msg="Seeked /var/log/syslog - &{Offset:56911 Whence:0}"
level=info ts=2021-04-30T16:35:57.780646032Z caller=tailer.go:125 component=tailer msg="tail routine: started" path=/var/log/kern.log
level=info ts=2021-04-30T16:35:57.781289004Z caller=filetargetmanager.go:254 msg="Adding target" key="{job=\"varlogs\"}"
level=info ts=2021-04-30T16:35:57.787770104Z caller=tailer.go:125 component=tailer msg="tail routine: started" path=/var/log/grafana/grafana.log
ts=2021-04-30T16:35:57.782276009Z caller=log.go:124 level=info msg="Seeked /var/log/grafana/grafana.log - &{Offset:0 Whence:0}"
Visualize logs using Loki and Grafana
Grafana provides built-in support for Loki. Loki already exists in the Grafana data source.
Step 1: Go to Grafana settings and click on “Data Sources”.

Step 2: Under Data Sources, you can search for sources by name or type.
Step 3: Search for the name Loki. You can see that this data source already exists in Grafana. Click Select.
Step 4: Enter a name for your data source and, since you are starting Loki on port, change the URL to http://localhost:3100 (if Loki is running on a different server than Grafana, change this to the server IP address). 3100.

Click the Test and Save button at the bottom. If Loki is set up correctly, you will see the following message in a green box.
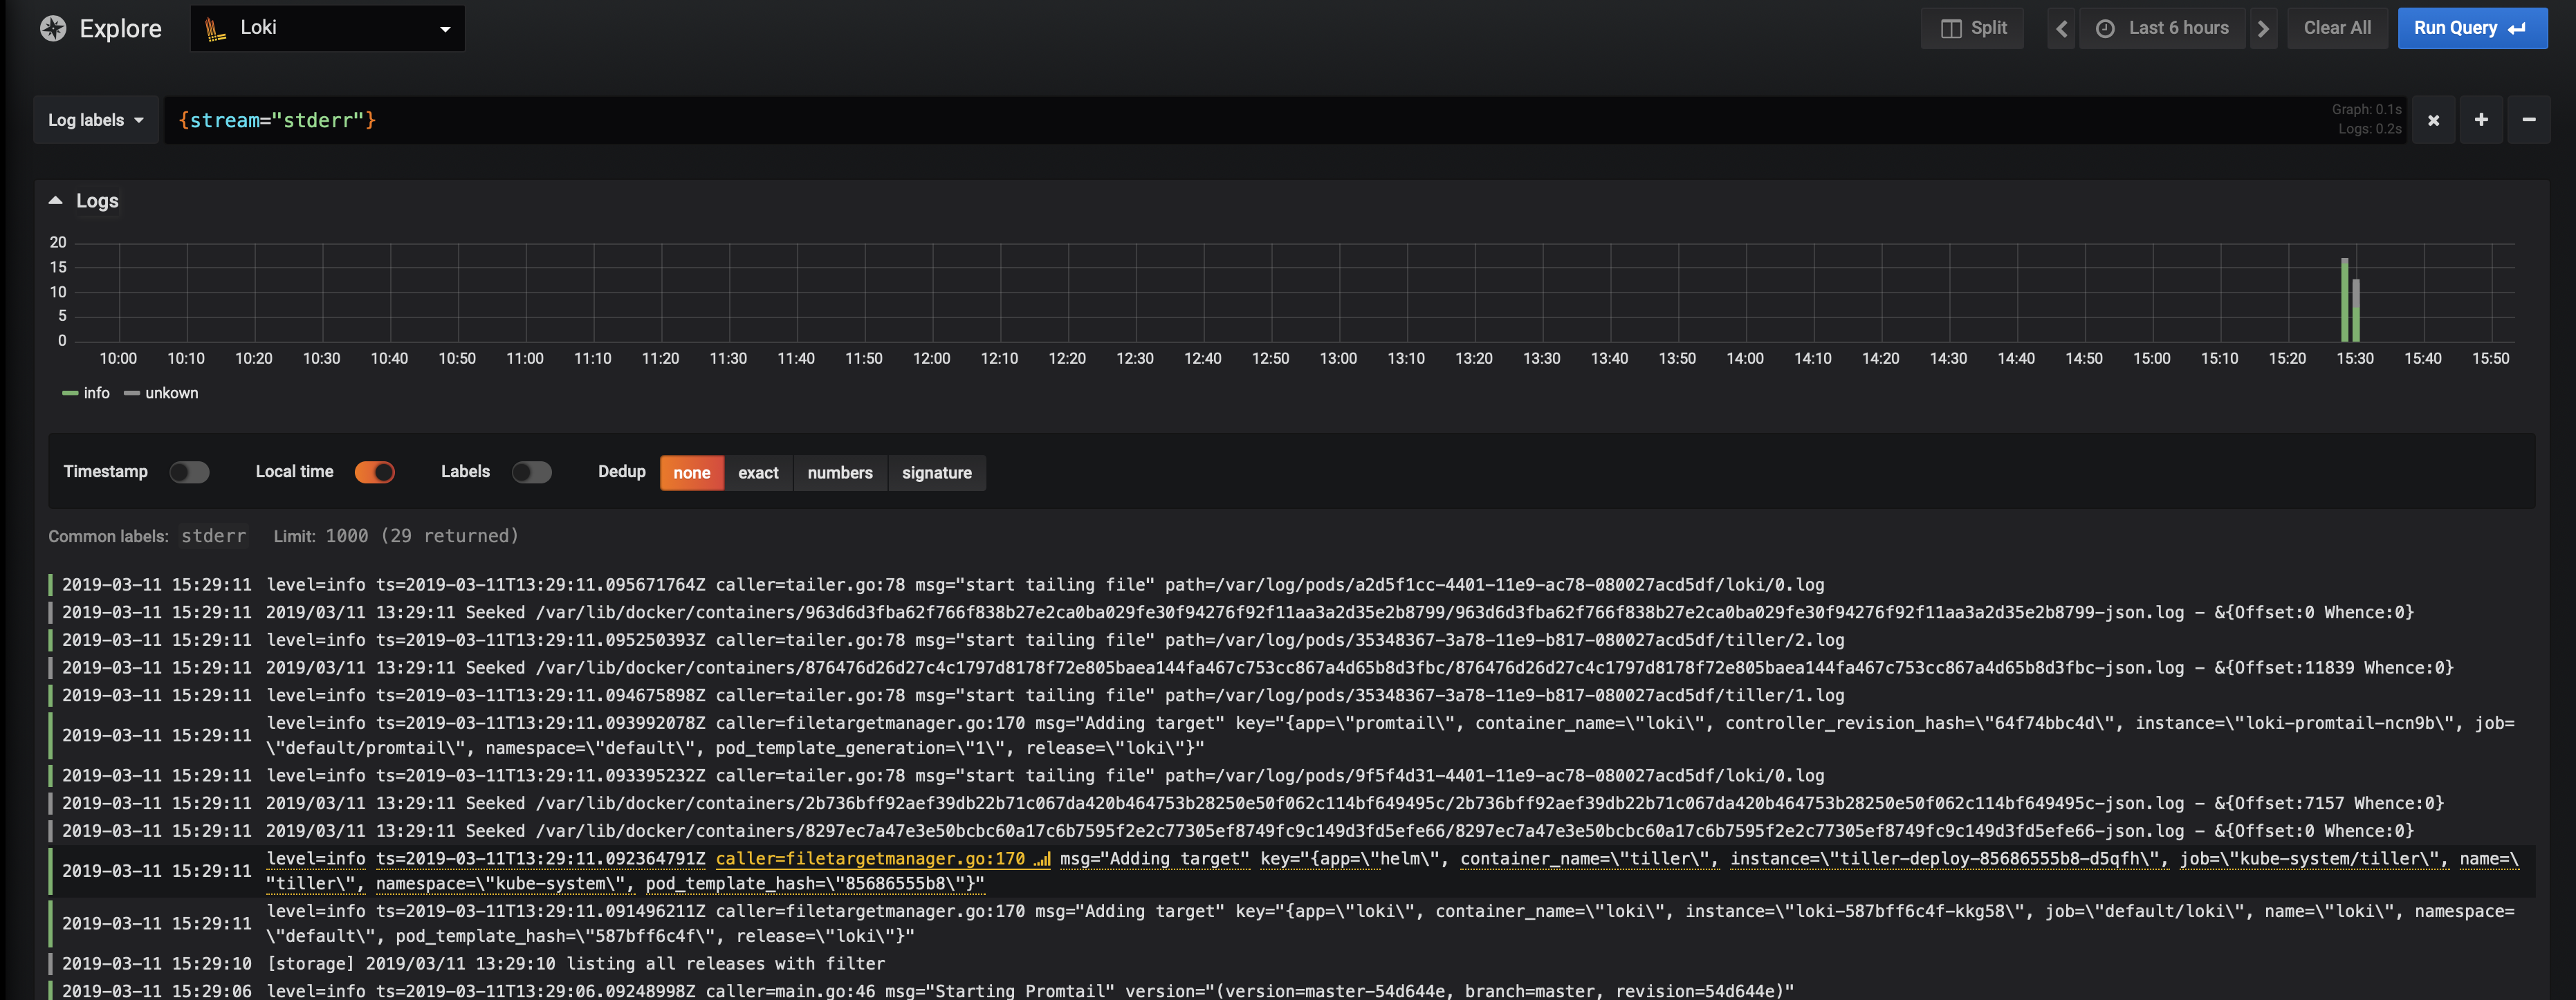
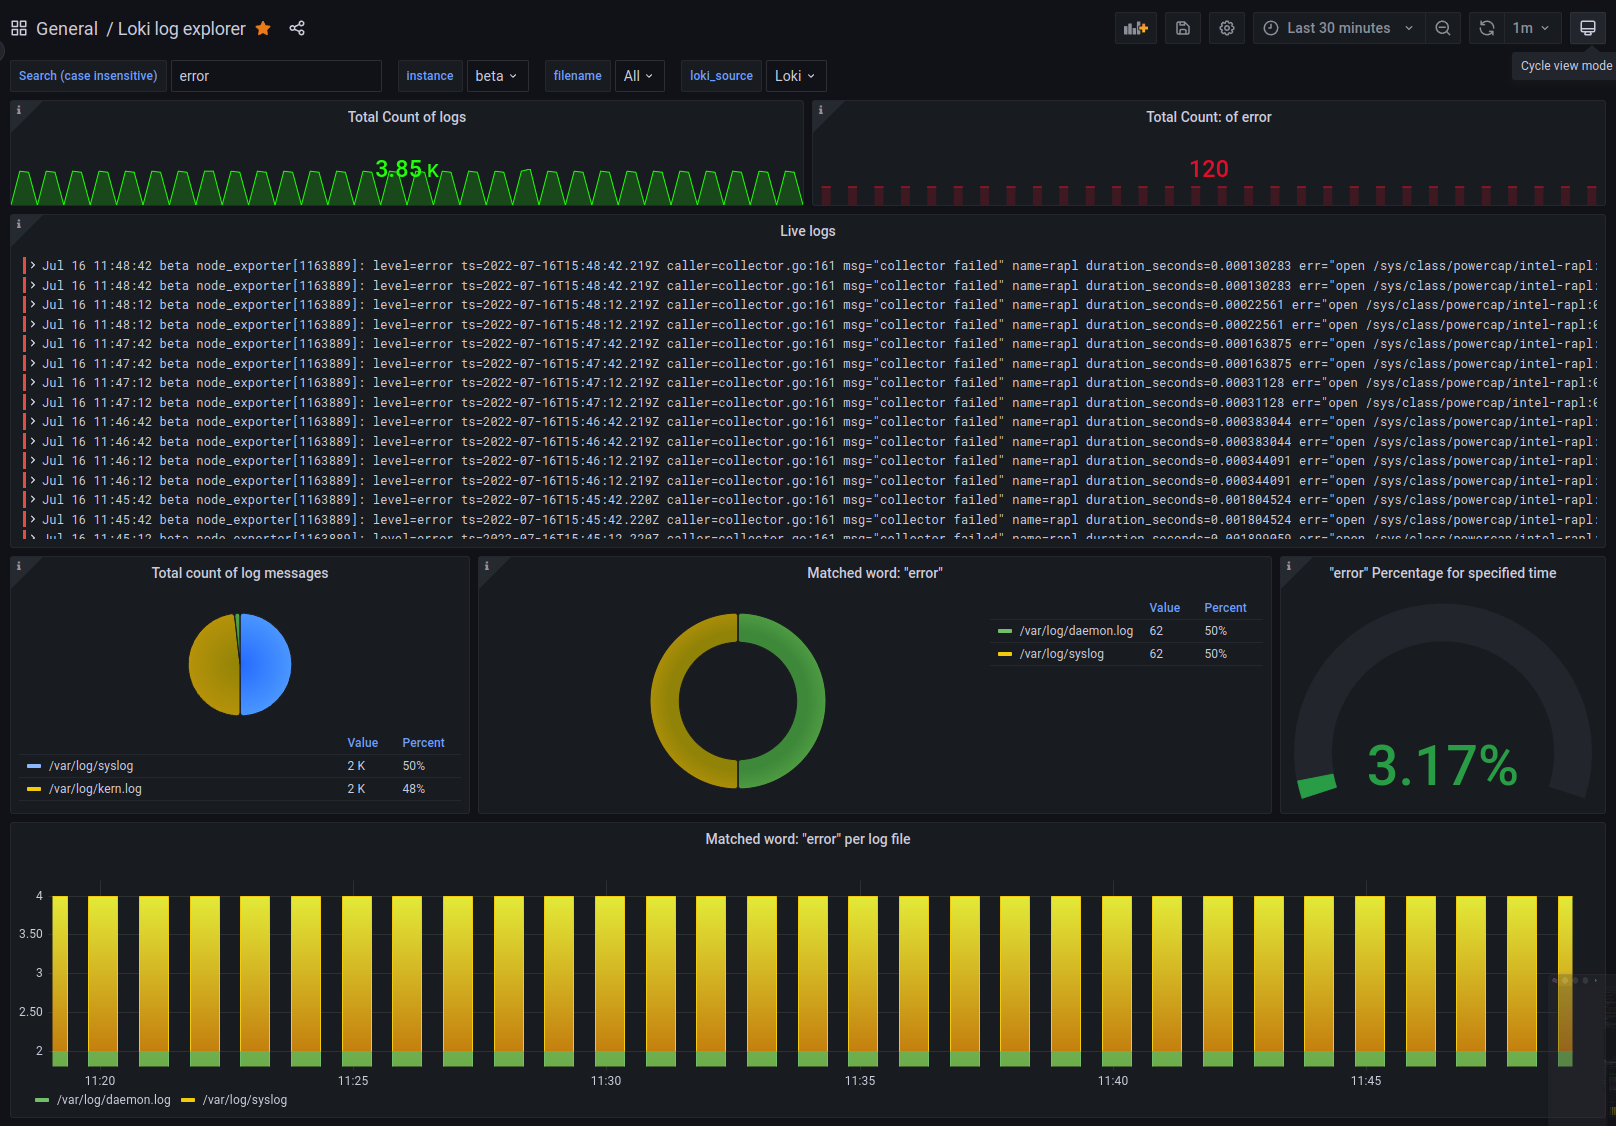
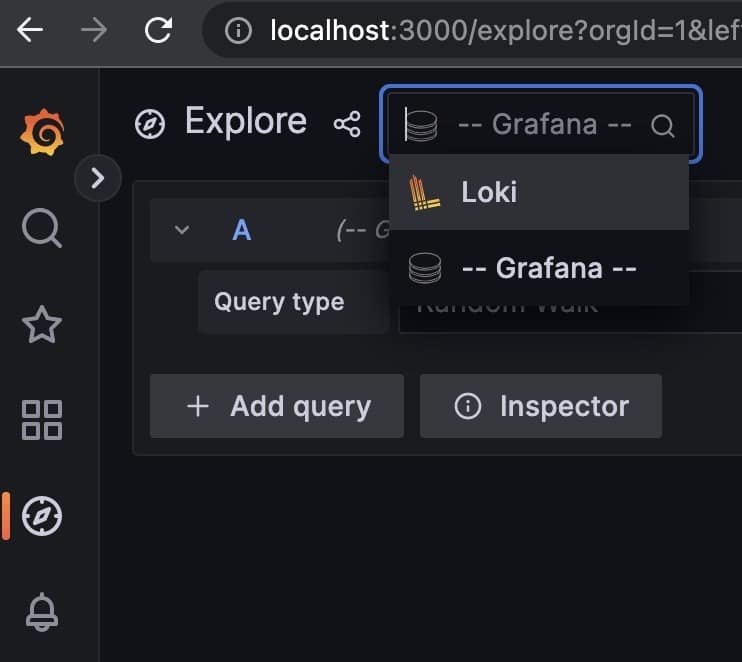
Step 5: Click the Explore tab on the left. Select Loki from the data source selection dropdown. Now, I would like to visualize the activity in the Grafana log. To do this, you need to add the query <em>{filename="/var/log/grafana/grafana.log"}</em> in your log browser. The green bars below are entries for events in the log file.
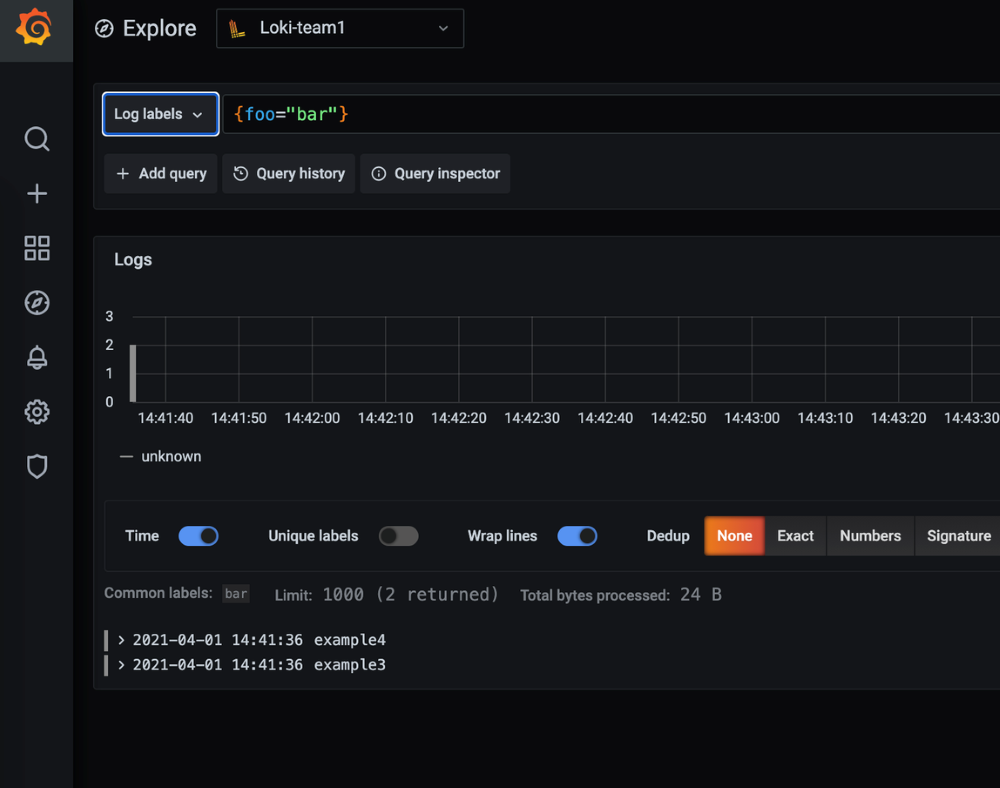
You can select a time range to display visualizations on your dashboard. You can also set the query refresh interval before the query is rerun. To see more details about a log, scroll down and click on one of the log entries, which will display all kinds of information related to the log.
It’s beautiful.
So, that was the beginning. We highly recommend checking out the following webinar videos that discuss observability in Loki.
conclusion
A distributed system consists of many applications or microservices, each containing large amounts of logs. You need a cost-effective way to collect, store, and use logs. Loki is the perfect solution for such cases. In fact, integrating Loki into your production environment can reduce your logging and monitoring costs by approximately 75%.
Loki is also available from Grafana Cloud . If you don’t want to go through the installation process, we recommend you give it a try.
Next, learn about Grafana Tempo.


![How to set up a Raspberry Pi web server in 2021 [Guide]](https://i0.wp.com/pcmanabu.com/wp-content/uploads/2019/10/web-server-02-309x198.png?w=1200&resize=1200,0&ssl=1)

")


 in Roblox")
")


")


")


")
