Keeping a check on your graphics card’s temperature can give you a lot of insight into its overall health and performance levels. Cooler temperatures indicate that the GPU is working properly in your setup. However, abnormally high temperatures suggest a problem with your GPU or your PC in general. Your desktop PC case may not have enough airflow, one (or more) of your GPU fans may have stopped spinning, or it may be something else entirely. PC components (particularly the GPU) generate heat, and too much heat can cause irreparable damage. Therefore, maintaining GPU temperature is always a wise move.
Whether expensive or cheap, monitoring the temperature of your graphics card from time to time is a great way to check if everything is okay. That said, there are multiple ways to check the GPU temperature on your desktop PC. 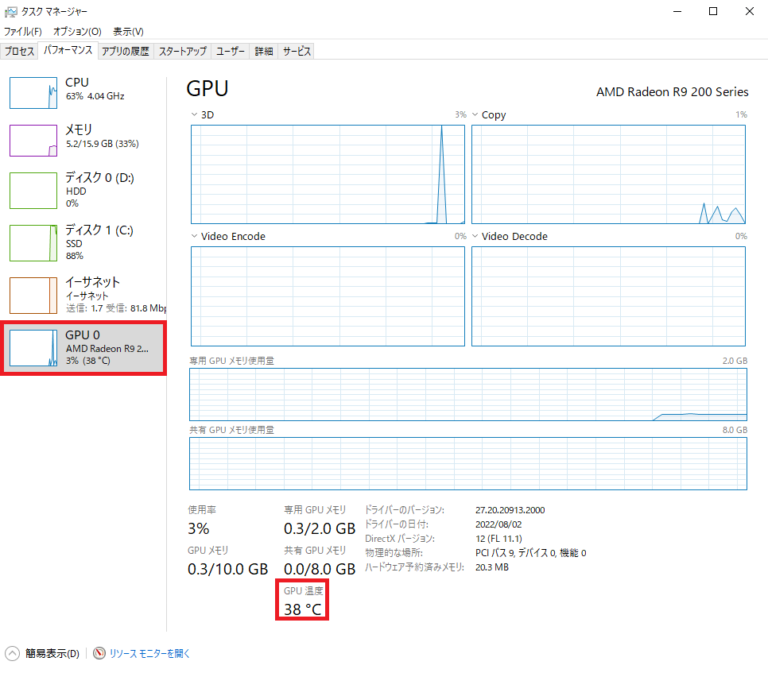
Check GPU temperature in Windows Task Manager
You can easily read the current GPU temperature using Windows Task Manager. Nothing special, but it gets the job done. Here’s how to check your GPU temperature using Task Manager:
Step 1: Launch Task Manager
The quickest (and probably easiest) way to start Task Manager is to press the Ctrl, Shift, and Esc keys on your keyboard at the same time. Alternatively, you can choose the old-fashioned approach by pressing the Ctrl, Alt, and Del keys simultaneously and selecting “Task Manager” from the options.
However, if keyboard shortcuts aren’t your thing and you prefer a mouse to navigate Windows, we’ve got you covered. Right-click the taskbar and select “Task Manager” from the context menu.
Step 2: Go to the Performance tab.
Inside Task Manager, you’ll notice a pane on the far left that contains multiple icons. Click on the icon that looks like a heart rate monitor (Performance tab, second icon from the top).
You can also display labels for each icon by clicking the hamburger menu button in the left pane. Now click on “Performance”.
Step 3: Check the graphics card temperature
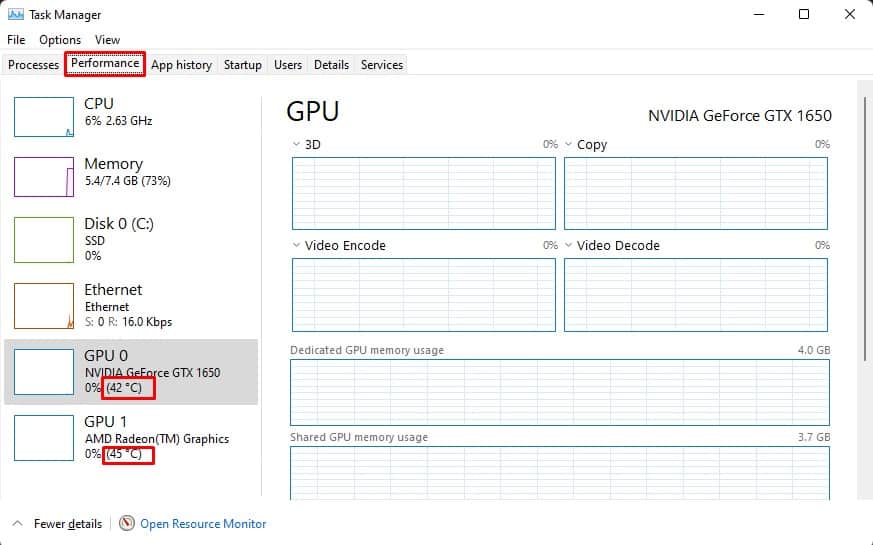
Inside the Performance tab, you’ll see different sections for different hardware (CPU, Memory, Disk, Wi-Fi/Ethernet, GPU).
Note : If you have a laptop with a dedicated GPU, you will see two GPU entries in the Performance tab: GPU 0 and GPU 1. The former will have an integrated GPU, while the latter will have a dedicated GPU.
When you select a GPU by left-clicking on it, you will see that the GPU metrics are loaded in the right pane. Scroll to the bottom to see the temperature readings for your graphics card.
Check graphics card temperature via GPU software
AMD graphics card
If you’re a proud owner of a Radeon GPU, you can check your GPU’s temperature using AMD Adrenalin software. Here’s how it works:
1. Make sure you have AMD Adrenalin software installed on your PC. If you haven’t already, please visit the official AMD Adrenalin download page here. Select your GPU model and click Submit.
2. Next, click the “+” icon next to the name of the operating system you are currently using. Displays the driver versions available for your OS. Click the ” Download ” button to get the installer.
Note : Once downloaded, run the installer and follow the on-screen instructions. When the software prompts you to select a profile, choose one according to your use case (we recommend using the standard profile). The preparation is now complete.
3. Press Alt + R to launch the Adrenalin software (this shortcut also works while gaming). Alternatively, you can launch it by right-clicking the desktop and selecting “AMD Adrenalin”.
4. Next, go to the Performance tab from the top navigation bar.
5. At the bottom of the Performance page, you will see real-time metrics such as CPU, GPU, VRAM, and RAM. To check your graphics card temperature, click the Additional Metrics option to expand the GPU section.
6. The expanded GPU menu will show all the details and look like this:
Note : Junction temperature is the hottest point (basically a hot spot) on the GPU die.
The Performance tab also shows other metrics such as current GPU usage, clock speed, power consumption, and fan speed. Kudos to AMD for taking such an intuitive and user-friendly approach to GPU software design.
Nvidia graphics card
If you have an Nvidia GPU, you can check the GPU temperature through the GeForce Experience app. Here’s how:
1. While installing the driver for your GPU, the GeForce Experience app may have already been installed. However, if you don’t have it, visit the official Nvidia GeForce Experience page to download the software. Click the download button to run the installer and follow the on-screen instructions.
2. Press “ Alt + Z ” simultaneously to launch the GeForce Experience overlay. It will look like this:
3. Then click Performance in the top right corner of the screen. Under the Performance tab, you can see the current GPU temperature and other metrics such as current GPU clock speed, voltage, utilization, power, fan speed, and memory clock. 
Check graphics card temperature using third-party tools
1. Open the hardware monitor
OpenHardwareMonitor is a free open-source software that can be used to measure various parameters of your PC, such as clock speed, voltage, and most importantly, temperature. You can download OpenHardwareMonitor from here .
Just run your application and click the “+” sign next to GPU. The view will expand to show the current temperature of your GPU and the maximum temperature recorded.
You can also run OpenHardwareMonitor in the background when you run benchmarks or games to track GPU temperatures under load.
Note : You can also use LibreHardwareMonitor (free, download ), a fork of OpenHardwareMonitor. Both are open source and essentially the same. However, LibreHardwareMonitor displays additional information such as CPU core distance to TjMax, core max, and core average. Both work fine for measuring GPU temperature.
2.HWiNFO
You can also use HWiNFO, a popular tool in the PC community. HWiNFO can be downloaded from here. Launch the application and select “sensor only” mode.
Similar to OpenHardwareMonitor, it opens real-time logs for all your hardware. Scroll down to where your GPU is listed and you’ll see the current minimum, maximum, and average temperatures.
What is the right GPU temperature for gaming?
That’s a great question! What’s the point of checking the temperature if you don’t know what the value means? Context is key.
Laptop GPUs run at 80-90 degrees Celsius and can be cold, but desktop GPUs running at 90 degrees Celsius (or higher) is a big no-no. Ideally, a case with good airflow and properly configured fans should keep GPU temperatures below 80 degrees Celsius. Unless you have a blower-style GPU. It gets hot and the fan makes a loud noise.
Occasional temperatures above 80 degrees Celsius are no problem and will not damage your graphics card. However, if your GPU regularly operates above 90 degrees Celsius, you run the risk of damaging it and shortening its lifespan.


![How to set up a Raspberry Pi web server in 2021 [Guide]](https://i0.wp.com/pcmanabu.com/wp-content/uploads/2019/10/web-server-02-309x198.png?w=1200&resize=1200,0&ssl=1)

")


 in Roblox")
")


")


")


")
