The world of social media has grown exponentially over the past few years, and more and more people have jumped on the bandwagon. Today, it’s more than just an identity or a way of communicating; it permeates the entire industry.
There are over 4.76 billion social media users worldwide. With the advent of accessible technology, that number is expected to increase further. Social media is no longer a luxury only for the young and educated. It has become a source of information, entertainment, networking, marketing, and even income for many.
Be it new-age content carriers like Facebook, Instagram, Twitter, or TikTok, they all manage to create disruption in their spheres and change the way the world works. In fact, despite various bans, TikTok has achieved a cumulative growth rate of 100% in just two years since 2020, making it the fastest growing social media platform.
Read on to find out which platform took the crown and what the social media stats and user trends are like.
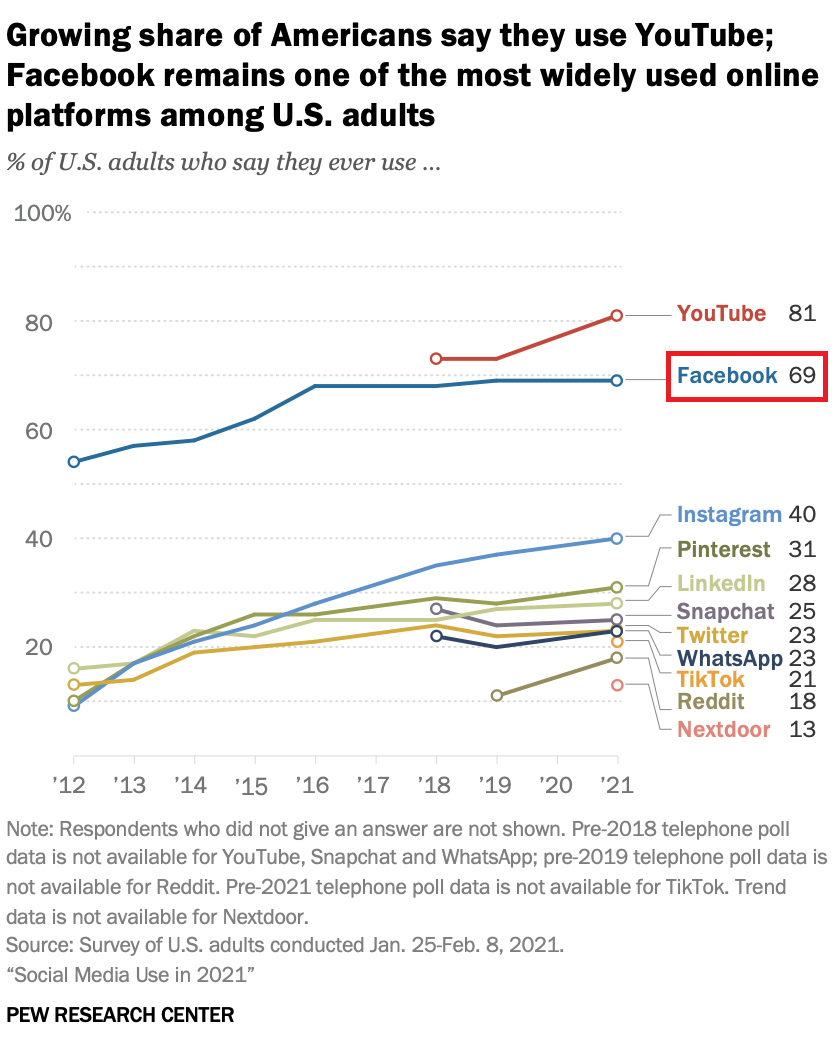
Remember when you used to play Farmville on Facebook? 😛 You might be wondering if anyone uses Facebook anymore. However, as the world’s digital population increases, social media reach and usage has also increased significantly across all social media platforms. Take a look at your social media usage statistics.
- The total number of active social media users increased by 3% year over year .
- With 2.96 billion monthly active users , Facebook remains the most widely used social media platform.
- With 2 billion active users , Instagram ranks fourth as the most active social media platform, just behind WhatsApp.
- The second most popular social media platform is YouTube, with 2.56 billion monthly active users.
- Platforms like Twitter and Pinterest lag far behind, with 556 million and 445 million monthly active users, respectively.
We have already seen the huge scale of social media. Now let’s see how to use it. We are spending more and more time on social media due to more engaging content formats, media formats, and increased frequency. We look at social media not only as an alternative to social life, but also as a news source, shopping portal, and more. To give you an idea of what’s really going on, here are some social media usage statistics.
- Around the world, people spend 38% of their total available time on social media.
- A typical social media user typically spends almost 2.5 hours a day on social media.
- Internet users between the ages of 16 and 64 actively use an average of 7.2 social media platforms each month.
- In terms of average time spent per day, Facebook ranks highest at 33 minutes . Below is the time spent on various platforms.

- LinkedIn is still struggling to establish itself as a popular social media platform, with average users spending less than a minute a day.
- An average of 694,000 hours of video are streamed every minute by YouTube users, which is more than even Netflix.
- Nearly 47% of social media users use platforms to keep in touch with friends and family, and 30-35% use platforms to deal with boredom, read news, or find content. I’m doing it.
- About 26% of users are there to search for products to buy, which is not surprising since global sales through social media platforms are estimated at $992 billion .
- Social commerce sales are expected to reach an estimated $2.9 trillion by 2026.

engagement rate
How do you measure your success on social media? Through metrics, of course. Reach, impressions, and engagement are essential for a successful social media campaign. Let’s take a look at which social media platform is winning this particular battle.
- TikTok topped the charts in 2023 with an impressive median engagement rate of 5.69% , followed by YouTube at 5.24%.
- Median engagement rates on Facebook and Instagram have declined this year, to 0.06% and 0.47% across all industries.

- When it comes to average engagement rates, TikTok still tops the charts with 4.25% (calculated by followers) and 5.1% (calculated by views).
- Instagram has an average engagement rate of 0.6% , while Facebook has an average engagement rate of 0.15%.

Posting frequency
Facebook’s median number of posts per week by industry is 5.04, while Instagram’s median is slightly lower at 4.6 posts per week.

Twitter’s median across all industries is 3.91 tweets per week, and TikTok gets a median of 1.75 videos per week (with the highest engagement, content format is very important!).
- SimplyWeb found that Youtube was the most visited social media platform in March 2023 with 33.6 billion visits, followed (not very closely) by Facebook with 17.6 billion visits . .
- In March 2023, Twitter reached 6.6 billion visitors, while Instagram caught up with 6.4 billion .
- According to a report by Edison Research , Facebook ranks highest in brand awareness among 95% of the U.S. population over the age of 12.
- The report ranked Instagram second with 91% brand awareness, followed by TikTok at 88%, Twitter at 87%, Snapchat at 84%, Pinterest at 71%, and LinkedIn at 64%.
- 42% of social media users believe TikTok will deliver the highest ROI in 2023, and 34% of users believe Instagram Reels.
User demographics
Marketing has taught us that not all customers are the same. Therefore, marketing messages need to be targeted and customized to people of different ages, genders, nationalities, etc. It’s important to know who is on which platform and what happens. May it be the best choice for your business.
Here are some important social media demographic statistics to help you make better decisions about your social media marketing.
- The global gender distribution of social media users favors men at 53.7% .
- As of January 2023, Facebook has the highest number of users aged 25-34 worldwide at 29.9% .
- Nearly 43% of Facebook’s total user base is female.
- A total of 30.8% of Instagram users are between the ages of 18 and 24, and nearly 17% of all users are men in this age group.
- Twitter users are 62.9% male and 37.1% male (the largest gender gap of any social media platform!).
- As of January 2023, 54% of Youtube users are male.
- TikTok has more female users ( 54% ).

- Indians spend the most time on social media, accounting for 44.4% of their total available time.
- India has the most active users on Instagram with 229 million followers , followed by the US with 143 million followers.
- Demographics are essential variables in understanding who is where. Internet users between the ages of 16 and 24 are more likely to use Instagram, and Tiktok is growing in popularity with this age group.
- Meanwhile, users between the ages of 55 and 64 are most likely to spend time on WhatsApp.

Social media advertising is no longer new. A successful marketing strategy is incomplete without the right mix of social media. Here are some interesting social media advertising statistics.
- Statistics show that as of January 2023, $226 billion is being spent annually on social media advertising, an increase of 23.2% year over year.
- 4 billion advertisers use Facebook Stories ads every month.
- By 2024, Instagram’s ad revenue per user will be $42 , compared to $36 for Facebook.
- Facebook’s average cost per click is $0.97 , Instagram’s is $3.56, and LinkedIn’s is the highest at $5.26.
- Facebook’s average cost per mille is $7.19 per 1,000 impressions . Instagram’s asking price is slightly higher at $7.91, while Pinterest is the most expensive at $30.
- Facebook has the highest potential ad reach of all social media platforms at 1.98 billion . Therefore, you cannot skip this particular channel when planning your next campaign.
- Platforms like Instagram and Tiktok are also aiming to become successful advertising channels with potential ad reach of 1.32 billion and 1.05 billion respectively.
influencer marketing
Influencer marketing has become a major trend change in the world of social media. This has given rise to a whole new type of content, allowing people to really harness the monetization power of social media. This has allowed marketers and people from various industries to take advantage of new marketing and revenue streams, giving things a whole new color.
Let’s take a look at some important social media statistics regarding influencer marketing.
- Influencer marketing spending in the US is expected to reach $4.6 billion in 2023.
- 87% of marketers and 90% of content creators plan to grow their presence on Instagram.
- While 68% of marketers plan to leverage TikTok’s potential, Snapchat ranks lowest on their list of influencer marketing priorities, at just 4%.
- 45% of total paid collaborations take place on TikTok, with Instagram a close second at 39%.
- Video content is becoming more popular every year, which definitely explains YouTube’s average engagement rate of 50% compared to other video platforms.
- This also explains why Youtube has the highest influencer prices, with an average price of $418 .
- Across all platforms, fashion and beauty content had the highest percentage (25%) .
additional statistics
Now that we’ve covered the gist of social media statistics and trends, another very important point that marketers often forget is making your content device-friendly.
Statistics show that 91% of internet users use smartphones to access the internet. 65.6% use a laptop or desktop and 27.3% use a tablet. Consumer behavior varies across platforms, so marketers need to keep that in mind.
For example, YouTube users visit an average of 4.63 pages in the YouTube app, compared to 2.84 pages on their desktop or laptop. In this day and age, unless you create content for all kinds of devices, you have a lot of potential viewers!
last word
We hope you enjoyed reading this article as much as we enjoyed writing it.
We’ve compiled some stats to help you understand the state of social media today. These statistics can change significantly from year to year due to changes in technology, demographic patterns, and shortening attention spans.
What was at the top this year may not even be on the scene in a few years. Therefore, marketers need to be aware of changing social media trends in order to maximize the potential of social media and make their marketing efforts shine.
Keep these statistics for your next marketing campaign. 🙋♀️


![How to set up a Raspberry Pi web server in 2021 [Guide]](https://i0.wp.com/pcmanabu.com/wp-content/uploads/2019/10/web-server-02-309x198.png?w=1200&resize=1200,0&ssl=1)

")


 in Roblox")
")


")


")


")
